Ramp AI Index Reveals a July Peak in Enterprise Spending While Anthropic Experiences Its First Quarterly Dollar Add Slowdown

The artificial intelligence boom, characterized by unbridled corporate investment and exponential growth curves throughout the early mid-2020s, is encountering its first major structural plateau. According to the latest comprehensive data releases from financial automation platform Ramp and a newly amended S-1 filing from frontier AI lab Anthropic, enterprise spending on generative AI peaked mid-summer before leveling off. Ramp’s AI Index, which aggregates transaction data from more than 85,000 U.S. businesses, indicates that the top tier of heavy AI spenders reached their financial zenith in July 2026, followed by a noticeable summer contraction and a sluggish recovery into the autumn months. Simultaneously, Anthropic’s updated regulatory filings show its quarterly dollar additions shrinking for the first time in the company’s operational history, forcing market analysts to re-evaluate the trajectory of enterprise AI adoption, the concentration of market revenue among a handful of "whale" accounts, and the compounding deflationary pressures of rapid algorithmic efficiency gains.
The July Ceiling: A Detailed Breakdown of Ramp’s AI Index
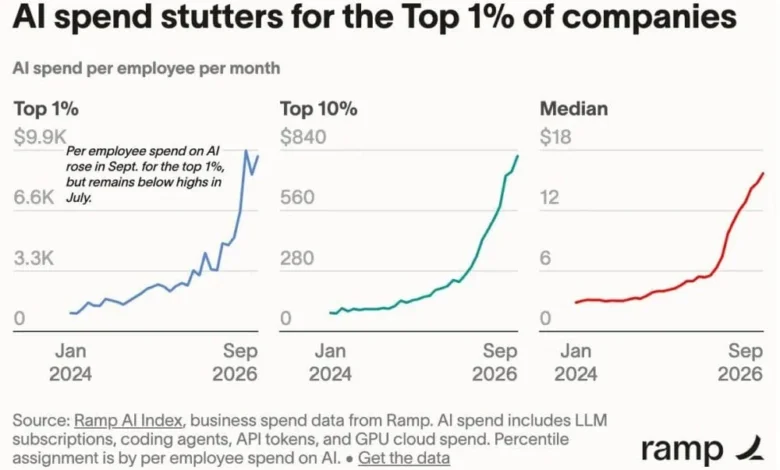
The primary indicator of the summer stall comes from Ramp’s spending metrics for the top 1 percent of its corporate customer base—a demographic heavily skewed toward tech-forward startups, software enterprises, and digital agencies that pioneered the heavy utilization of large language models and automated agents.
Data compiled by Ramp reveals that per-employee monthly spending for this elite cohort peaked in July at an astonishing $9,873. However, this high-water mark proved unsustainable. In August, spending among the top 1 percent dropped sharply by 13 percent, falling well off the July pace. While September saw a modest recovery with spending climbing back up to $9,568 per employee per month, it failed to fully recapture the July peak, remaining down by roughly 3.1 percent.
In contrast, the broader corporate ecosystem exhibited different behavioral patterns. The top 10 percent of spenders continued a steady upward trajectory, moving from $740.47 in August to $813.43 in September—representing a healthy 10 percent monthly growth rate. Meanwhile, the median firm on the Ramp platform saw its monthly AI expenditure inch upward as well, though from a vastly different baseline. Analysts emphasize that because the top 1 percent represents a relatively small, highly specialized group of early adopters, its spending data is inherently more volatile than the median and top 10 percent aggregates. Nevertheless, the inflection point in July marks a psychological and financial shift among the market’s heaviest consumers.
Anthropic’s Q3 S-1 Amendment and the Deceleration of Revenue Momentum
Complementing the transaction data from Ramp, Anthropic’s amended S-1 filing paints a parallel picture of a maturing, yet decelerating, high-growth market. The document reveals that while the company’s total revenue continues to scale to impressive heights—reaching $16.96 billion in the third quarter of 2026, up from $11.56 billion in the second quarter—the actual quantum of revenue added quarter-over-quarter contracted.
During the first quarter of the year, Anthropic added $4.72 billion in revenue. This figure accelerated in the second quarter, with the company adding $6.84 billion. However, in the third quarter, the net dollar add dropped to $5.40 billion, representing a 21 percent decline in absolute dollar growth compared to Q2. This translated to a drop in average monthly growth from approximately $760 million per month in the second quarter down to roughly $580 million a month in the third quarter.
Market observers noted that this shift caused headline growth rates to recalibrate from a blistering 140 percent down to roughly 47 percent year-over-year. Within the quarter itself, Anthropic reported a $65 billion annualized run rate at the end of July, which averaged out to $5.4 billion a month. Because Q3 as a whole averaged $5.65 billion a month, it implies that August and September experienced modest growth in the range of 3 to 4 percent monthly. This temporal alignment between Ramp’s top-tier corporate spend data and Anthropic’s revenue deceleration reinforces the conclusion that the entire sector hit a plateau simultaneously following the mid-summer peak.
The Whale Effect: Heavy Concentration Among Elite Spenders
A critical structural vulnerability highlighted by the combined data is the extreme concentration of revenue generation. Industry analyses of Ramp’s payment streams indicate that an overwhelming 80 percent of total corporate expenditure on leading frontier models—specifically those of OpenAI and Anthropic—is driven by a mere 1 of businesses.
This disparity is staggering when examined at the per-employee level. In September, the median spend for top-tier companies stood at $9,567.53 per employee per month, contrasted against a mere $15.70 per employee for the median firm on the platform. This creates a spending gap of roughly 600 times between the most intensive enterprise users and typical businesses.
Anthropic’s regulatory filings echo this dynamic at the individual user level. Enterprise users utilizing advanced tooling like Claude Enterprise without specialized developer extensions averaged under $75 a month, whereas the top 5 percent of power users leveraging advanced coding assistants spent approximately twenty times that amount. In its risk disclosures, Anthropic explicitly warned prospective investors that any adverse change in demand from its largest, most concentrated customer cohorts could materially and adversely affect its business, financial condition, and future prospects. Essentially, a few hundred corporate entities operating autonomous agents around the clock generate the vast majority of frontier lab revenues. When these high-volume accounts pause their spending expansions, quarterly revenue growth slows, regardless of how many smaller businesses sign up at the bottom of the funnel.

Broadening Adoption and the Arithmetic of Replacement
Despite the spending stall among heavyweights, broader market adoption continues to expand incrementally. Ramp data shows that by September 2026, 55.9 percent of all U.S. businesses on its platform were actively paying for AI services, representing a 0.6 percentage point increase over August figures.
However, the mathematical reality of replacing "whale" spend with baseline adoption is deeply skewed. A single top-tier firm with 100 employees spending nearly $1,000 per head generates close to $1 million in monthly revenue. To match the output of that single enterprise, an AI provider must successfully onboard and retain approximately 600 median-tier firms of identical size. Because a 0.6 percent monthly gain in adoption predominantly captures smaller businesses at the lower end of the distribution curve—where per-capita spending is minimal—these new additions cannot immediately offset a plateau or minor pullback by top-tier spenders.
Furthermore, new adopters are increasingly diversifying their vendor relationships. Among Ramp-tracked businesses, Anthropic adoption edged up by 0.25 percentage points to 43.8 percent, while OpenAI adoption grew by 1.12 percentage points to reach 40.6 percent, outpacing overall AI market adoption growth. Despite OpenAI capturing a broader slice of corporate sign-ups, Anthropic maintained its dominance in dollar volume, capturing 60.5 percent of all business token spending on Ramp during the final week of October 2026.
Deflationary Pressures: The Impact of Model Price Cuts
While market commentators initially speculated that the mid-summer slowdown could be attributed to seasonal factors—such as executive and engineering vacations during August—economic analysis suggests a far more potent driver: aggressive pricing deflation.
Ramp lead economist Ara Kharazian points directly to falling prices for top-tier models as a primary mechanism behind the revenue and spending plateau. Anthropic’s S-1 filings corroborate this hypothesis, demonstrating that the rollout of models like Claude Opus 5.5 reduced customer costs per task by approximately 40 percent compared to its predecessor, Claude Opus 5. Independent financial analysis of the filing estimates that third-quarter price reductions across the industry shaved roughly $600 million off aggregate customer billing expectations.
Under this economic model, if an enterprise heavy user maintains a static workload of automated tasks from month to month, a 40 percent reduction in cost per task automatically lowers its aggregate bill by a commensurate margin. To maintain flat spending—let alone historic growth rates—these enterprises would have been forced to increase their workload volume by nearly two-thirds in August and September. Because they did not scale their computational output at that precise velocity, top-line expenditures dipped.
Seasonality alone fails to account for the mathematical gap. To match Q2’s dollar additions, Anthropic would have needed roughly $1.44 billion more in Q3 revenue—representing about 8 percent of the entire quarter. Historical data from holiday periods, such as the December slowdowns which typically impact business activity by about 20 percent for a two-week stretch (roughly 3 percent of a quarter), suggest that an August vacation slump would need to be 2.5 times more severe than Christmas to explain the entire shortfall. Price deflation, therefore, remains the more convincing causal factor.
Market Implications and Future Outlook
The convergence of Ramp’s index data and Anthropic’s financial disclosures marks a maturing phase for the enterprise artificial intelligence sector. The era of frictionless, hyper-exponential growth driven purely by exploratory corporate spending is giving way to a more disciplined economic reality.
For the broader B2B software and AI ecosystem, the implications are clear. Companies operating in the generative AI space are increasingly subjected to the same operational pressures as traditional enterprise software providers, where efficiency gains inherently compress top-line pricing power. As frontier labs continue to optimize their algorithms and lower the cost of intelligence, revenue expansion will increasingly depend on driving broad-based volume across the median business market rather than relying exclusively on the hyper-consumption of a handful of elite corporate whales.
Market analysts and investors are now closely monitoring upcoming reporting cycles to determine whether the mid-summer slump was merely a temporary digestion period for enterprise deployments or the beginning of a permanent structural shift in how corporate America budgets for artificial intelligence. The upcoming release of October run-rate data will provide the definitive test of whether the market’s largest spenders have resumed their expansion or if the ecosystem has settled into a more sustainable, cost-optimized steady state.